Newham Development Finance Outlook 2026: Senior Debt at 6.5 Per Cent at 70 Per Cent LTGDV on Mid-Rise Resi-Led
Senior development finance on a Newham mid-rise resi-led scheme is clearing 6.5 per cent per annum at 70 per cent LTGDV in April 2026. That sits inside Tower Hamlets, inside Hackney, and broadly in line with the Walthamstow comparable. The lender pool reads the Plaistow, Forest Gate, East Ham and Manor Park corridor as conventional mid-tier resi-led delivery at 4 to 8 storeys, 40 to 200 homes, on brownfield with strong PTAL and a £550 to £650 per square foot sales line. Stretched senior is available to 75 per cent LTGDV at 7.5 per cent where the cost plan and contractor cover hold up. On Royal Docks high-rise BTR-led stock the senior tier is 6.65 per cent at 65 to 70 per cent LTGDV, with the forward-fund commitment compressing 25 to 50 basis points of construction-layer pricing. Newham is where the senior pool prices most legibly in the inner-east.
Why Newham is the largest single-borough pipeline in London
If you draw a ring around the active and consented development pipeline in any London borough in 2026, Newham has the largest by a meaningful margin. The Royal Docks Mayoral Opportunity Area alone consents around 36,000 homes across the Royal Albert, Royal Victoria, King George V dock estates plus Silvertown Quays plus the Asian Business Port footprint. The Queen Elizabeth Olympic Park is into the East Bank cultural quarter delivery phase across 2025 to 2027 with V&A East, BBC Music Studios, UCL East and Sadler’s Wells East, anchoring a wider Stratford pipeline that has never stopped moving since 2012. Canning Town is the early-stage Lower Lea Valley regen sub-zone. Plaistow, Forest Gate and East Ham are mid-tier resi-led growth corridors. Beckton is the outer-fringe DLR catchment.
That structural pipeline plus a lower starting price base is the explanation for the -1.5% borough number. Newham’s average sold price sits in the £550 to £650 per square foot range across the borough mix, materially below the inner-east neighbours. The borough is closer to viability than almost any other London borough on equivalent build cost and equivalent capital stack. When London corrects, Newham corrects less because it had less premium to give back, and because the structural absorption story is doing real work to support the comparable set.
Reading the -1.5% in context
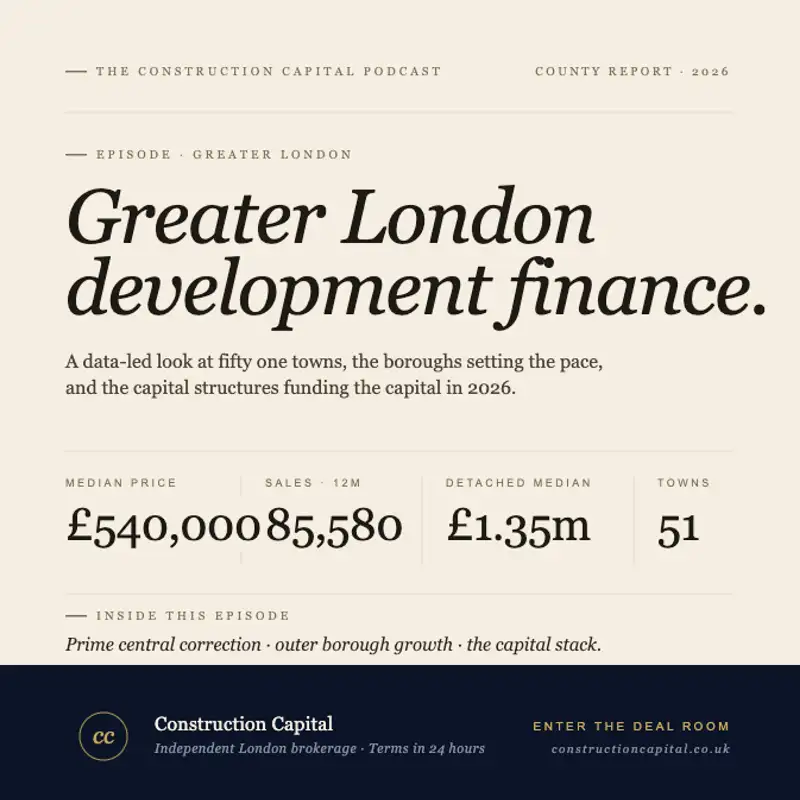
Greater London’s headline house-price index fell 3.3% year on year in February 2026 to a regional median of around £542,000 across roughly 85,580 transactions in the rolling twelve months. New-build completions ran at just 1.9% of total activity. Newham’s -1.5% is 1.8 points above the regional benchmark, the cleanest soft-mid-band positive read in inner-east London.
The peer-set comparison is informative. Tower Hamlets to the west sits at -3.8%, dragged by the high-rise re-sale layer in Canary Wharf and the Isle of Dogs. Hackney to the north-west is at -2.5%. Walthamstow to the north is up 5.9%, the next-door inner-east outperformer with no high-rise layer to digest. Redbridge to the north-east is up 5.3%, riding the Elizabeth Line catchment. Newham sits between the two structural growth zones to the north and the institutional re-sale drag to the west, and the -1.5% reflects exactly that midpoint position. Lower entry point, structural pipeline absorption, but enough new-build investor stock in Stratford and Royal Docks to keep it slightly negative on the headline.
The other framing that matters. Newham at -1.5% is 9.7 points better than Kensington and Chelsea at -11.2%, and 9.3 points better than Westminster at -10.8%. Newham is structurally on the other side of the London correction map from the prime boroughs. It is where the lender pool wants the next generation of inner-east BTR consents to land.
The sub-zone anatomy
Stratford and Queen Elizabeth Olympic Park (E15 / E20). The post-Olympic regen anchor and the borough’s most diversified sub-zone. East Village BTR cluster, Westfield retail, the East Bank cultural quarter in delivery through 2025 to 2027 (V&A East, BBC Music Studios, UCL East, Sadler’s Wells East), the emerging £3bn Stratford life-sciences cluster. Crossrail / Elizabeth Line, Jubilee, DLR, Overground, Stratford International. The most connected single station node in inner-east London. The structural growth thesis here is the East Bank plus life sciences plus PBSA forward-fund pipeline anchored by UCL East and the wider higher-education footprint.
Royal Docks (E16). The 36,000-homes Mayoral Opportunity Area. Royal Albert, Royal Victoria and King George V docks plus Silvertown Quays plus the Asian Business Port plus the wider Custom House Crossrail catchment. The single largest active development pipeline in London by GDV. Connectivity through Custom House on the Elizabeth Line, the DLR Royal Docks branches, and the Cable Car. ExCel on the dockside as the structural commercial anchor. This is where the BTR forward-fund pipeline is most active in 2026.
Canning Town (E16). The early-stage Lower Lea Valley regen sub-zone immediately west of the Royal Docks. Jubilee Line and DLR interchange. Land assembly is the active activity in 2026. Bridging-financed pre-consent acquisitions, mid-rise resi-led delivery on the leading sites, and a forward pipeline that connects directly into the Royal Docks masterplan to the east.
Plaistow, West Ham and Upton Park (E13 / E15). Mid-tier resi-led, 4 to 8 storey brownfield mid-rise the dominant typology. West Ham sits on the Jubilee, District, Hammersmith & City and DLR interchange, one of the most under-rated transport nodes in inner-east London. The capital stack on these sub-zones is conventional. The borough number applies as a fair read here.
Forest Gate (E7). Mid-tier resi-led growth corridor. Elizabeth Line at Forest Gate station has been the structural catalyst since 2022. Mid-rise schemes on the Romford Road frontage, Victorian terrace stock as the conversion anchor in the streets to either side. One of the most consistent mid-tier resi-led delivery zones in the borough.
East Ham and Manor Park (E6 / E12). Family resi heartland. More affordable, deeper average per-square-foot mid-band, lower premium tone. District / Hammersmith & City Line at East Ham. Elizabeth Line at Manor Park has done meaningful work to lift the catchment since 2022. Where £650 per square foot viability is most legibly real on a small-to-mid scheme.
Beckton (E6). Outer-fringe DLR-linked. Industrial-fringe brownfield as the dominant typology. Conventional capital structure. The Beckton DLR terminus and the connectivity to the Royal Docks branches make it a credible peripheral sub-zone for mid-rise resi-led product.
Why the Royal Docks 36,000-homes pipeline matters
The Royal Docks Mayoral Opportunity Area Planning Framework is the largest single-area consenting framework in London. The OAPF was refreshed across 2024 and 2025 with the explicit objective of streamlining viability and density on the 36,000-homes pipeline through delivery. For the developer audience the practical effects are three.
One. Density and height parameters across the consenting envelope are settled. That removes the most common source of viability slippage on inner London consenting in 2026, late-stage density renegotiation. On a Royal Docks site under the OAPF, the density and height envelope is in the bag at acquisition, not at planning resolution.
Two. The viability evidence base sits at the OAPF level rather than scheme by scheme. That accelerates the planning timetable on conforming schemes and reduces the cost of viability evidence for individual developers. For mid-cap developers the OAPF is the structural enabler.
Three. The institutional capital pool reads the OAPF as a structural risk-down on consenting risk. BTR forward-fund commitments at Royal Docks are pricing the OAPF in. Net yields at 5.0% to 5.5% on credible Royal Docks BTR schemes are tighter than the comparable Hackney Wick yield range, and that compression is in part the OAPF effect.
The Royal Docks pipeline is what makes Newham a 2026 to 2030 structural delivery story rather than a single-cycle correction read.
What lenders are pricing on Newham schemes in 2026
Following the Bank of England’s December 2025 cut to 3.75%, the all-in capital stack on a typical Newham scheme is one of the most lender-friendly in London. The borough is materially closer to Walthamstow pricing than Tower Hamlets pricing, the structural pipeline plus the lower entry-point base plus the Crossrail catchment all clear viability comfortably.
Senior development finance on a Plaistow, Forest Gate or East Ham mid-rise resi-led scheme is available from 6.5% per annum at 70% LTGDV for an experienced developer with strong cost certainty in the 40 to 200 home range. Senior debt on a Royal Docks BTR-led tower scheme is available from 6.65% per annum at 65 to 70% LTGDV, slightly tighter on the high-rise tier but well inside Tower Hamlets pricing because the BTR forward-fund commitment compresses the back-end risk. Stretched senior products start around 7.5% and reach 75% LTGDV where the cost plan and contractor are bankable. Mezzanine finance prices from 12% per annum and stretches gearing to 85 to 90% of cost. Bridging on Canning Town pre-consent land assembly and Royal Docks off-market windows starts from 0.55% per month at up to 75% LTV.
The BTR forward-funding layer is the structurally active product on Royal Docks schemes. Institutional BTR take-outs are clearing 5.0% to 5.5% net yields on credible Royal Docks institutional schemes, broadly in line with Hackney Wick at 5.0% to 5.5% net and Wandsworth Battersea at 5.0% to 5.5% net, 25 to 75 basis points wider than Tower Hamlets Isle of Dogs at 4.75% to 5.25% net. That spread is the build-phase versus delivered-and-absorbed spread, not a credit spread on Newham.
The PBSA forward-funding layer at Stratford East Bank sits in the 5.0% to 5.25% net yield range, the tightest PBSA yield range in inner-east London. The catchment combination of UCL East, the University of East London, Queen Mary’s Mile End footprint via Stratford, plus the wider East Bank academic cluster is the tightest student-housing demand pool in inner-east London on a 10-year forward horizon.
The Stratford East Bank PBSA and life sciences forward-fund pipeline
The East Bank cultural quarter at Stratford is the most actively-funded single regen footprint in London in 2026. UCL East phase one is delivered. UCL East phase two is in delivery through 2027. V&A East opened in 2025. BBC Music Studios is in delivery. Sadler’s Wells East opened in 2025. The wider life-sciences pipeline at Stratford, anchored by the UCL East research footprint and the emerging £3bn life-sciences cluster, is the structural commercial counterpart to the resi pipeline.
For developers, the practical effect is two-sided. PBSA forward funds are clearing 5.0% to 5.25% net on credible Stratford East Bank schemes, the tightest PBSA yield range in inner-east London. Life-sciences-adjacent commercial-led mixed-use on the East Bank fringe is one of the few non-resi forward-fund products in inner London with a credible 2026 transaction comparable set. Stratford is the borough’s commercially diversified sub-zone in a way no other Newham sub-zone is, and that commercial diversification is part of the borough’s resilience read.
What is actually transacting in Newham
Five categories of scheme are running across the borough in 2026.
BTR forward-fund take-outs at Royal Docks. The dominant product by GDV, the pipeline runs to over £1bn of forward-fund commitments across the Royal Albert, Royal Victoria, King George V and Silvertown Quays footprints. Single-operator estates, 200 to 1,000+ units, mid-rise to tower-led. Take-out yields 5.0% to 5.5% net. This is the borough’s structural product.
PBSA forward funds at Stratford East Bank and the UCL East / UEL cluster. 5.0% to 5.25% net yield. The tightest PBSA yield range in inner-east London. Active pipeline through 2026.
Canning Town early-stage land assembly and small mid-rise. Bridging-financed pre-consent acquisition is the active phase. The leading sites are into mid-rise resi-led delivery, conventional senior plus mezz capital stack.
Plaistow, West Ham, Forest Gate and East Ham mid-rise resi-led. 4 to 8 storeys, 40 to 200 homes, brownfield. Conventional capital stack, the schemes most likely to clear the Time-Limited Planning Route at 20% affordable housing by habitable room. Where £650 per square foot viability is most legibly real on a small-to-mid scheme.
Beckton outer-fringe DLR-linked mid-rise. Industrial-fringe brownfield, conventional capital structure, peripheral but credible.
How the capital stack works on a £40-60m GDV Royal Docks BTR scheme
A typical mid-cap Royal Docks BTR-led scheme at this scale, with strong PTAL within a 10-minute walk of Custom House Crossrail or a DLR Royal Docks station and a clean planning consent under the refreshed OAPF, can be financed with senior development finance at 65 to 70% LTGDV (around 6.65% to 7.00%), mezzanine layered to 85 to 90% of cost (12% plus), and an institutional forward-fund commitment locking the take-out at 5.0% to 5.5% net yield. The forward-fund commitment compresses senior pricing on the construction layer by 25 to 50 basis points relative to an open-market resi structure of the same scale, because the back-end exit risk is materially de-risked.
Blended cost-of-funds on a forward-funded Royal Docks BTR scheme can sit in the high sixes, meaningfully tighter than the equivalent open-market resi structure on the same site, and competitive with the Hackney Wick equivalent. That is the operative argument for the Royal Docks BTR product in 2026.
On a larger scheme (£60m to £200m+ GDV, and Royal Docks routinely supports schemes at this scale), the institutional senior pool re-engages with multiple competing tranches, mezzanine providers compete for allocation, and the BTR forward-funding conversation widens to include co-living and PBSA-adjacent operators. Royal Docks is the only borough sub-zone in London outside Tower Hamlets where £150m+ GDV BTR schemes are structurally routine in 2026.
What this means for site acquisition
If you are pricing land in Newham in 2026, three things matter more than they have in any recent cycle.
One. Newham is the borough where £650 per square foot viability is meaningful in real time. On most adjacent inner London sites the £650 per square foot threshold is a notional viability line. In Plaistow, Forest Gate, East Ham and the Canning Town fringe it is the actual sold-price threshold the appraisal sits on top of. That makes Newham the cleanest read on the rest of the inner-east London viability map. If a site does not work at £650, the 2026 lender pool will not finance it, and Newham is where that test runs in real time.
Two. The Royal Docks BTR forward-fund take-out at 5.0% to 5.5% net is the structural product the borough is for. If you have a Royal Docks consent that supports the BTR yield calculation, with credible rental tone, density consent under the OAPF, and operational delivery economics, that is a financeable product on better terms than an open-market resi structure on the same site. The pipeline depth here means the take-out conversation is competitive across multiple institutional pools.
Three. The post-NPPF planning regime, the Mayor’s emergency package, the Time-Limited Planning Route at 20% affordable housing by habitable room, and the refreshed Royal Docks OAPF all favour Newham schemes that move quickly through to delivery. Capital is available for Newham schemes ready to start, whether that is BTR forward-funded construction debt at the Royal Docks, conventional development finance on a Plaistow or Forest Gate mid-rise, bridging for a Canning Town pre-consent land assembly, or PBSA forward funding for a Stratford East Bank scheme.
For full borough-by-borough sold price data, the Newham BTR pipeline references, viability modelling and the underlying capital stack benchmarks behind this analysis, see the Greater London Property Market Report 2026. Borough-specific intelligence sits on the Newham location page.
See also: Walthamstow +5.9% on YouTube and The £650/sq ft Cliff on YouTube.
Listen to the full episode
For the dedicated deep dive on this borough, we have published a stand-alone Newham episode of the Construction Capital podcast: Newham -1.5%: The 36,000-Homes Royal Docks Pipeline, Stratford East Bank, and the £650/sqft Borough Where Viability Bites. Around fifteen minutes covering the Stratford / East Bank / Royal Docks / Canning Town / Plaistow / Forest Gate / East Ham / Beckton sub-zone read, the BTR forward-fund yields driving the institutional pipeline, the full April 2026 capital stack, and what is actually transacting in 2026.
This article also draws on Episode 2 of the Construction Capital podcast: Greater London Property Development Finance 2026: Market Analysis, House Prices and Lending Outlook. The full borough-level data, policy detail and capital stack discussion runs 15:30, with chapters covering Walthamstow, Bromley, Hackney and the inner-east boroughs within the wider Greater London outlook.
Listen anywhere
Listen on Apple Podcasts, Spotify, Overcast, Pocket Casts, or Amazon Music.
For indicative terms on a Newham scheme within 24 hours, submit through the Construction Capital deal room.
Published by Construction Capital, an independent capital advisory brokerage sourcing terms from over 100 lenders across development finance, bridging, mezzanine, and equity. This article is part of the Greater London 2026 series accompanying the Construction Capital podcast.